
By Etienne Mercuriali, Head of Research, BMLL
SpaceX (SPCX) traded US$85.3 billion on 522 million shares, or 94% of float, during its first trading session. It closed 19.2% above its US$135 offer price and 7.3% above the opening cross. Most of that volume printed away from lit venues: off-exchange venues represented 60% of continuous trading, and no exchange held more than half the displayed depth near the touch.

BMLL level 3 data shows offer side passive liquidity recovered slower than bid side during aggressive trading burst in its first trading day.Â
While the book within 20 bp of mid rarely had more than US$1 million of resting liquidity, the largest directional bursts of trading represented only 6.0% of classified continuous notional but 14.8% of absolute signed flow. Selling produced the larger immediate price move, while buy-side pressure left offer liquidity at 36% of its pre trading burst level 5 minutes later.
SPCX continuous trading started at 11:46 ET on 12 June 2026, more than two hours after the US market opened. Nasdaq's opening cross printed 58.2 million shares at US$150, about 11% above the US$135 IPO price and equivalent to US$8.7 billion of stock. The first continuous print followed at US$150.01, and price discovery was active from there.
Over the first five minutes of continuous trading, SPCX ranged between US$139.05 and US$165.00 with a volume-weighted average price of US$155.17. The stock reached US$176.52 shortly after 13:10 ET, then drifted lower through the afternoon. The closing cross printed 7.85 million shares at US$160.95, leaving SPCX 19.2% above its offer price.
The total volume on this first day of trading was 522.1 million shares for US$85.3 billion. Continuous trading on lit venues accounted for US$29.1 billion and off-exchange execution for US$44.0 billion. The Nasdaq opening and closing crosses contributed US$10 billion, with the remainder in benchmark and special-price prints. Off-exchange venues handled 60.1% of continuous volume. Nasdaq executed 55.3% of lit continuous volume, the largest single share in an otherwise fragmented market.
Odd lots made up 81.3% of all executions but only 21.7% of shares traded.
Limited displayed liquidity, large turnover
The turnover sat on top of a small visible order book. Across the continuous session, median displayed liquidity within 20 basis points of the midpoint was US$527k on the bid and US$726k on the offer. At a US$160 share price, 20 basis points is 32 cents either side of the mid.
That measure excludes hidden orders and off-exchange interest, and displayed orders replenish and trade many times through the day, so it is not a count of all executable liquidity. It is the amount visible close to the mid at a given instant. Depth was thinnest through the opening period, when the price moved most, and settled near US$1.5 million combined for the rest of the session. Against US$85.3 billion of turnover, the first-day market relied on the repeated recycling of a small displayed book.
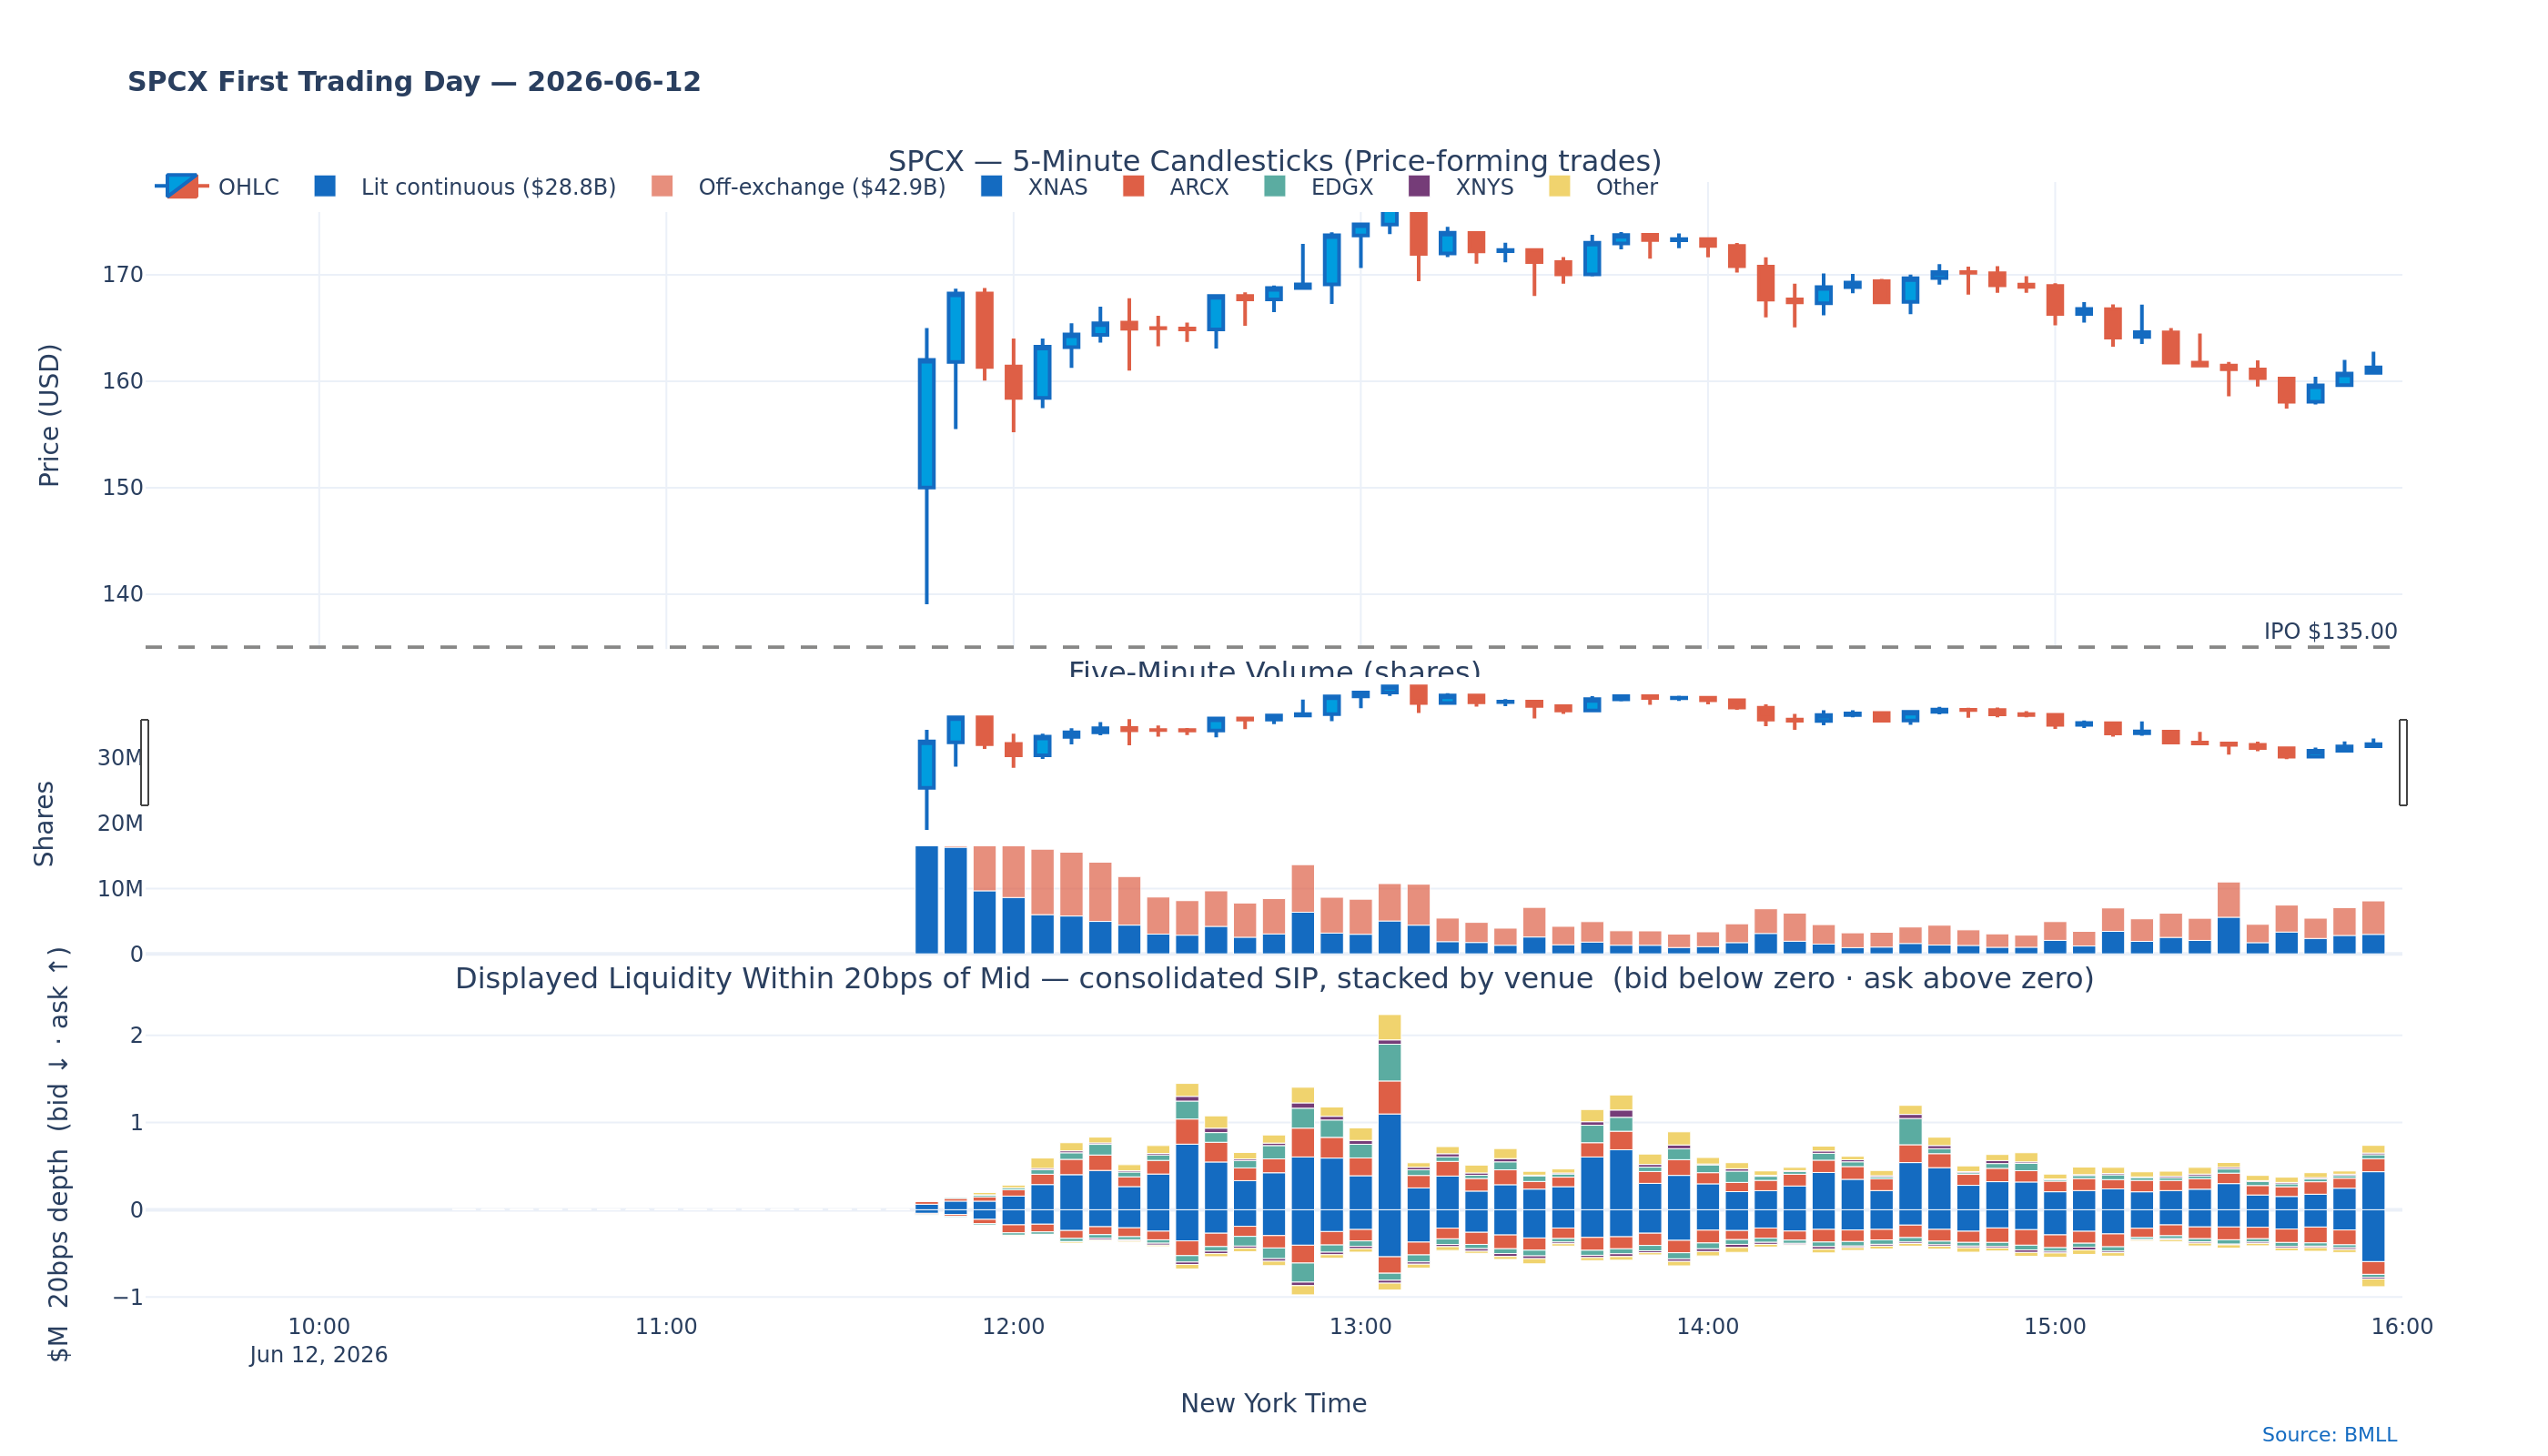
Source: BMLL Data Lab. Continuous trades, SIP quotes and displayed depth across 13 covered US lit venues.
Nasdaq executed 55.3% of lit continuous volume but supplied a median 46.7% of bid depth and 47.0% of offer depth within 20 basis points of the midpoint.
Aggressive buying leaves offer liquidity slower to recover
Our second analysis tracks how the book refilled around large directional trading bursts. It ranks one-second intervals by absolute signed notional, retains those above the 98th percentile where at least 70% of traded value was in one direction, and keeps only the largest burst within each two-minute window during continuous trading.
This produced 25 buy bursts and 35 sell bursts. Together, the selected bursts represented 6.0% of classified continuous notional but 14.8% of absolute signed notional, showing that they captured a disproportionate share of directional pressure rather than a large share of total turnover.
The median selected buy burst represented US$49.1 million of gross notional, compared with US$40.8 million for a sell burst.
The chart follows the midpoint, displayed depth on the side being consumed and the quoted spread from 60 seconds before each burst until five minutes afterwards. For buy bursts, consumed-side depth is the displayed offer; for sell bursts, it is the displayed bid. The middle panel indexes that depth to 100 using the pre-burst period: 100 means depth has returned to its prior level, while 50 means only half remains. Price moves are direction-adjusted, so a positive value means the midpoint moved with the aggressive flow.
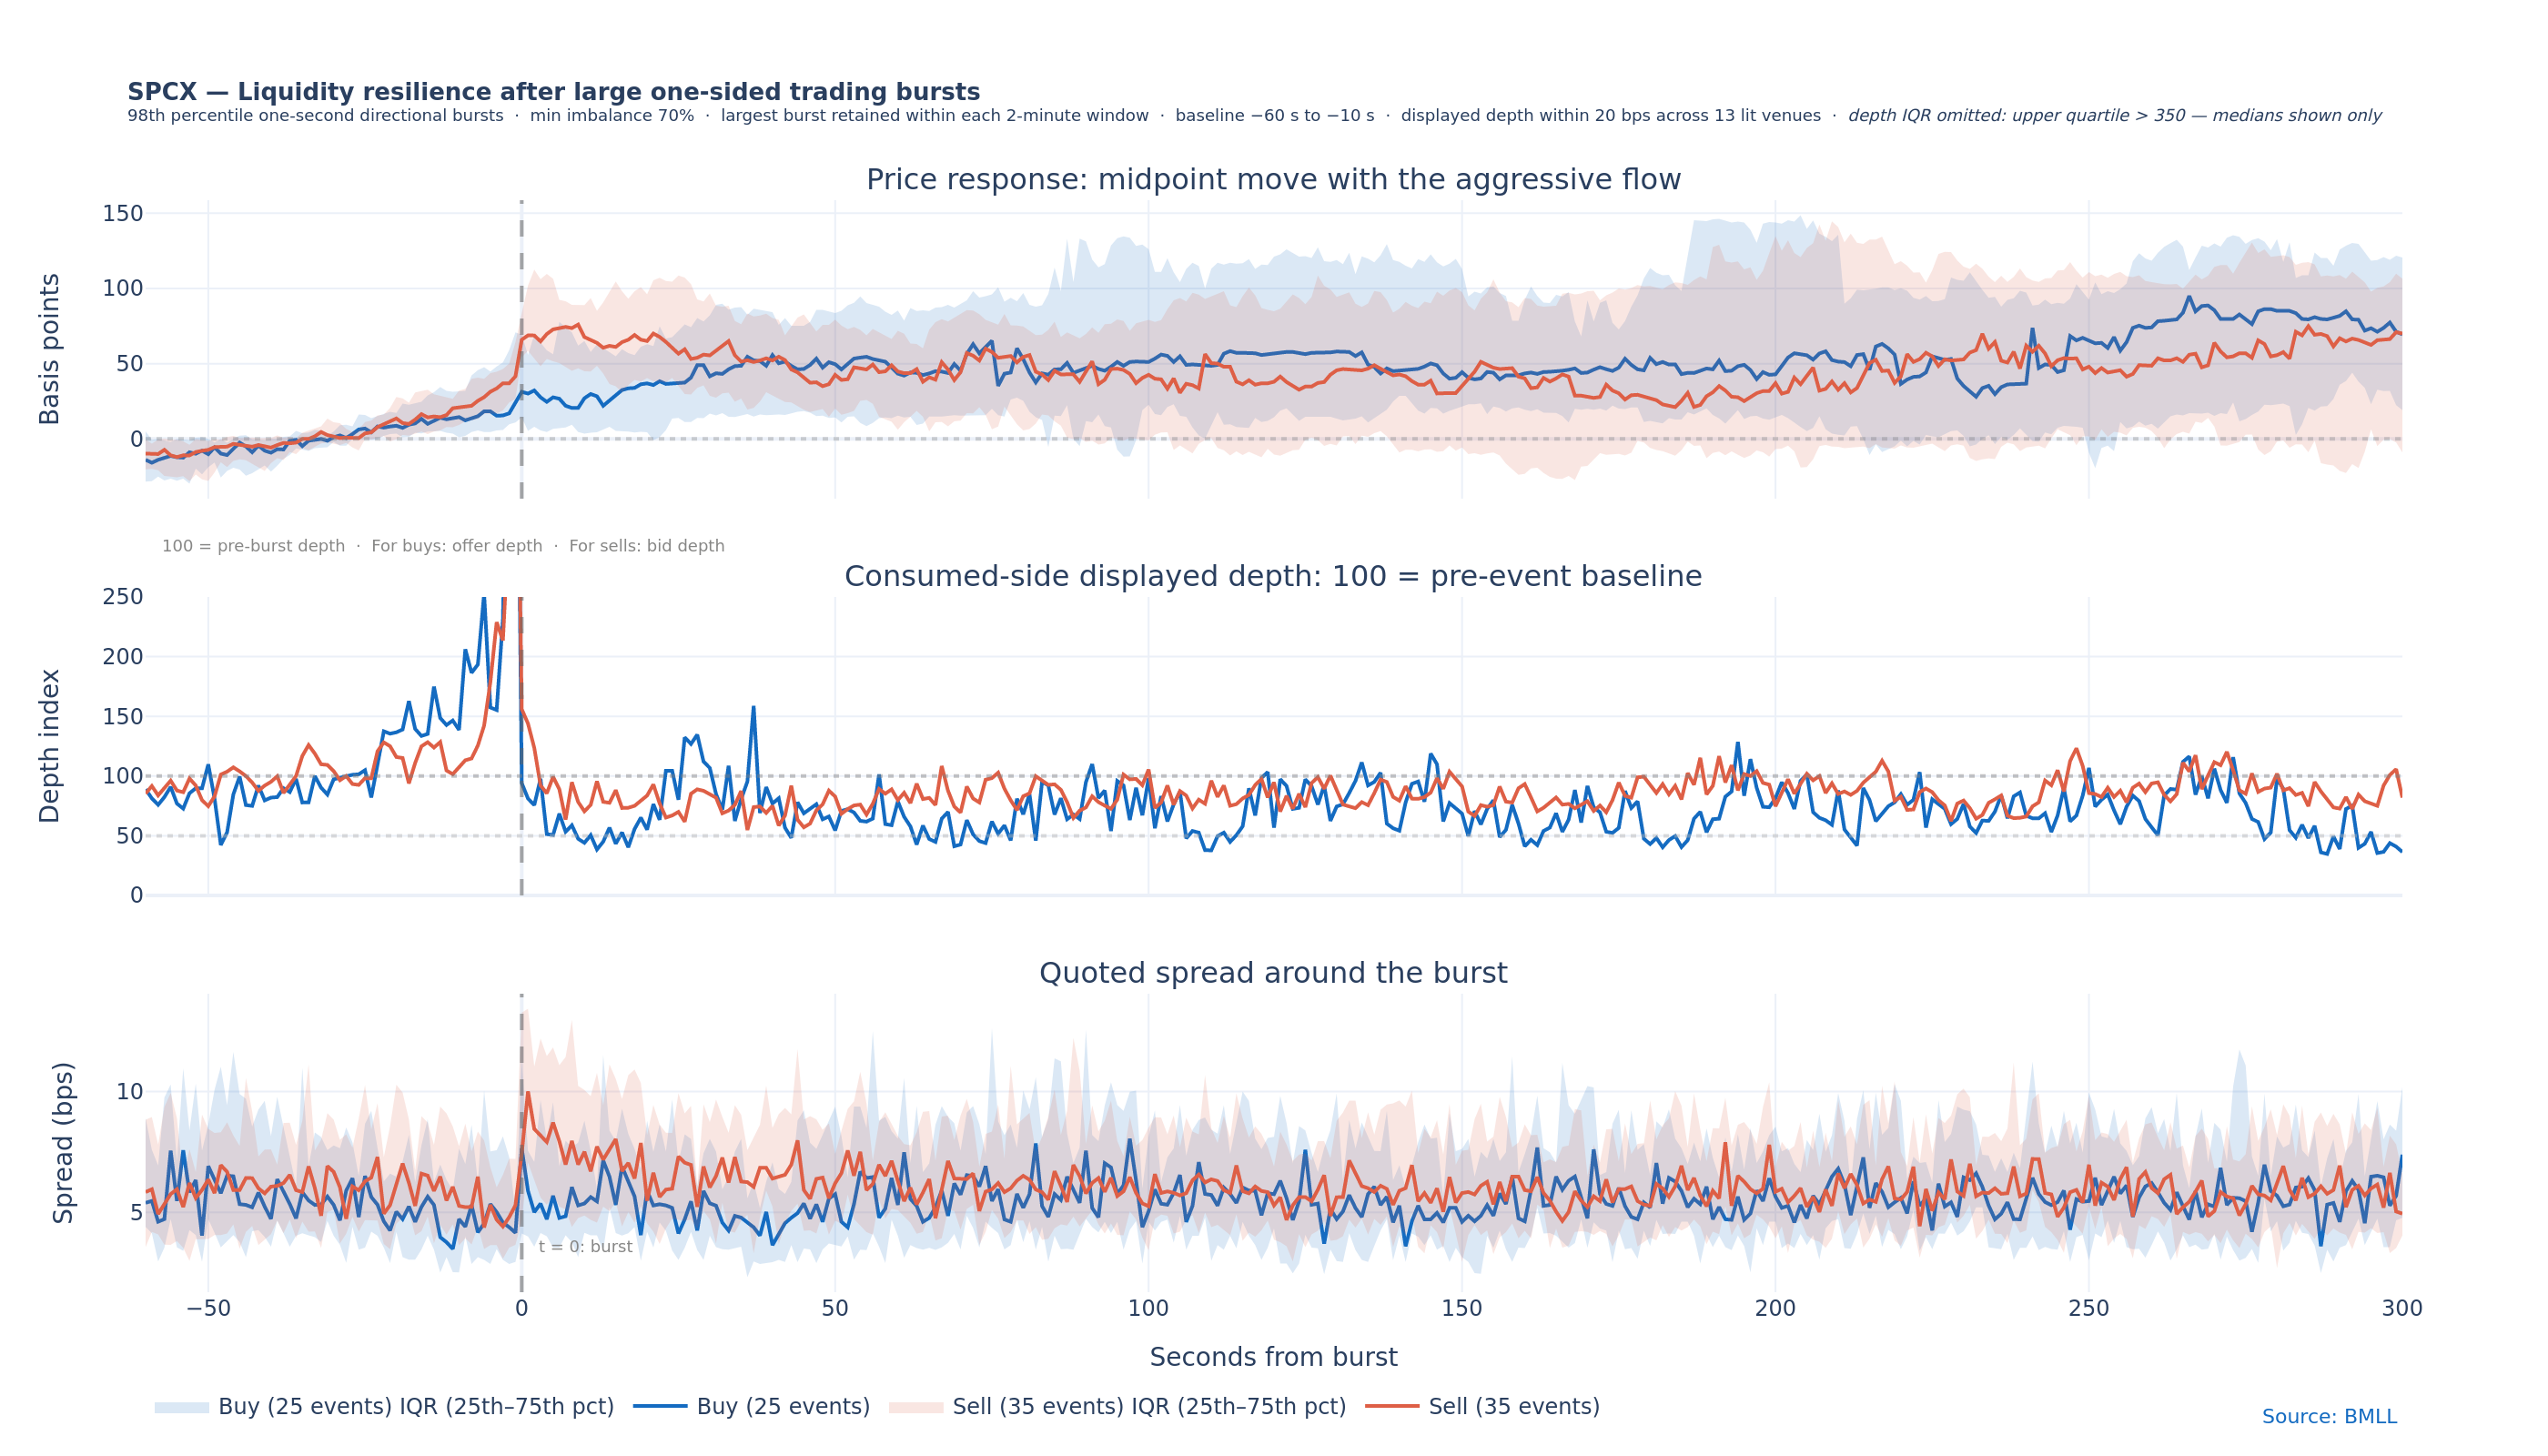
Source: BMLL Data Lab. 20 bps consolidated SIP depth.
Sell-offs produced the larger immediate price response. One second after the burst, the median midpoint moved 68.8 basis points in the direction of the selling, compared with 30.2 basis points following buy bursts.Â
During the first minute, the median event-level maximum quoted spread reached 17.9 basis points after sell bursts and 16.9 basis points after buy bursts.
Displayed liquidity was depleted in both directions. Ten seconds after buy bursts, offer-side depth stood at 44.1% of its pre-burst level. Following sell bursts, bid depth remained at 70.5%.
Five minutes later, the median midpoint response was similar in both directions: 69.5 basis points after buy bursts and 70.0 basis points after sell bursts. The depth response remained markedly asymmetric. Offer depth following buy bursts was still at only 36.4% of baseline, while bid depth following sell bursts had recovered to 81.9%.
Selling therefore produced the sharper immediate price response, but the clearest persistent difference was in the order book.Â
Conclusion
SpaceX was exceptionally liquid by turnover, but its first-day action relied on the repeated replenishment of limited displayed depth. Selling produced the sharper initial price reaction, but aggressive buying had more persistent effect on the visible order book, leaving offer side liquidity substantially depleted five minutes later.
Methodology: BMLL analysed first-day trades, SIP quotes and displayed depth for SPCX across 13 covered US lit venues (XNAS, XNYS, ARCX, BATS, BATY, EDGA, EDGX, XBOS, XPSX, IEXG, MEMX, XCIS, XASE) on 12 June 2026. Near-mid liquidity is displayed bid and offer size within 20 basis points of the SIP midpoint. The resilience study aligns large, strongly one-sided one-second trading bursts and compares midpoint movement, consumed-side depth and quoted spread with their pre-event levels. Figures exclude hidden and off-exchange liquidity. One-second quote resolution limits venue price-leadership attribution.


